Mobile Core Concepts
Memory and GC
Why a memory budget is a design constraint - and how GC pauses may cause dropped frame.
Half of all interview-grade mobile design questions hinge on memory. Photo gallery, newsfeed, doc editor all arrive at the same arithmetic: a 12 MP JPEG decoded into the Java heap is 46 MB, the heap caps between 256 MB and 512 MB depending on device, and the user is scrolling. A candidate who can explain where those bytes live, who frees them, and what the OS does when there's no room is several rungs ahead of one quoting Bitmap.recycle(). This page covers ART's GC topology, the three heaps that share physical RAM, bitmap accounting across API versions, the two OOM modes, GC pauses inside a 16.6 ms frame budget, and the reference-type vocabulary. The frame pipeline is How Rendering Works; the loader pipeline is Image Loading Internals.
The heap topology
Android replaced Dalvik with ART at API 21 and has incrementally rewritten the collector since. Since Android 8.0 (API 26) the default collector is Concurrent Copying (CC), a region-based copying collector; it became generational in Android 10 (API 29). The current shape is three regions inside the managed Java heap plus two more heaps outside it.
- Young generation is the focus of generational CC's frequent young collections. Most objects die young; CC concurrently copies the few survivors via read barriers, so collection completes well under a millisecond with only a tiny stop-the-world pause.
- Old generation holds tenured survivors, collected by the same Concurrent Copying collector in a full-heap pass. CC copies objects concurrently to defragment the region-based heap, so old gen does not accumulate the fragmentation an in-place sweep would leave.
- Large Object Space holds allocations larger than ~12 KB - big arrays, pre-API-26 bitmaps. Never compacted, so a long-running process accumulates fragmentation that costs allocation throughput even when nominally free.
The native heap is what malloc allocates. NDK code uses it directly; the framework uses it indirectly through Skia, OkHttp buffers, image decoders, AAudio. ART doesn't see it; freeing requires a free from C-side code, usually via a Java-side Cleaner.
The graphics buffer pool is allocated through Gralloc and managed by the compositor. Hardware bitmaps, Surface buffers, SurfaceFlinger layers live here, visible to the GPU and possibly outside the CPU's view of RAM on unified-memory devices.
All three share physical RAM but the OS accounts and pressures them separately:
| Heap | dumpsys meminfo row | Pressured by |
|---|---|---|
| Java | Java Heap | ART GC; per-process cap |
| Native | Native Heap | NDK code paths; libc allocator |
| Graphics | Graphics, GL, EGL mtrack | Gralloc; system compositor |
Only the Java heap cap (Runtime.getRuntime().maxMemory()) throws OutOfMemoryError. The other two contribute to system-wide pressure that lmkd watches.
ART GC modes and the frame budget
ART picks one of three GC algorithms based on trigger and state:
| GC kind | When it runs | Pause | What it collects |
|---|---|---|---|
| Young CC | Heap fills up; routine | < 1 ms | Young gen only |
| Full-heap CC | Young throughput drops; old-gen pressure | Single small STW pause, mostly concurrent | Whole heap, with concurrent copying defrag |
| Full / explicit | System.gc(), low-memory trim | Several ms, STW | Everything, with compaction |
System.gc() is a suggestion the runtime can ignore, but ART usually runs a full collection - which is why production code shouldn't call it. The "free up memory now" hook is onTrimMemory(). Even Concurrent Copying takes a brief stop-the-world pause to flip roots, and that cost cashes out as dropped frames at high refresh rates:
| Refresh rate | Frame budget | GC pause cost | Effect |
|---|---|---|---|
| 60 Hz | 16.6 ms | 2 ms = 12% of frame | usually invisible |
| 90 Hz | 11.1 ms | 2 ms = 18% of frame | occasional skipped frame |
| 120 Hz | 8.3 ms | 2 ms = 24% of frame | visible jank during fling |
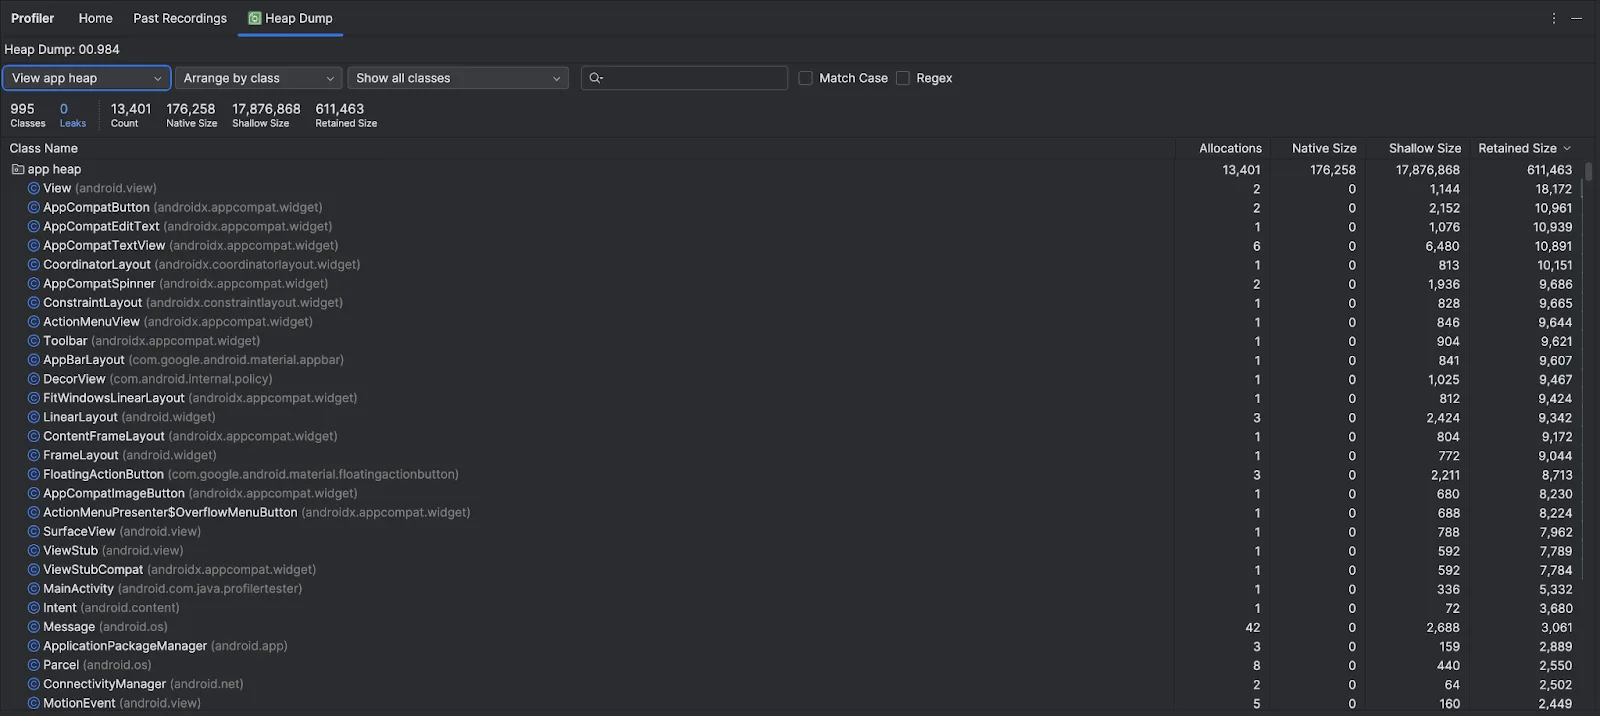
The mitigation is allocation pressure reduction, not pause tuning. ART decides when to collect; you decide how often you push it. A LazyVerticalGrid allocating a fresh List<Pair<Int, String>> per recomposition is the canonical antipattern - fling stutter is the symptom, GC firing 30 times a second is the cause. Perfetto's art:Heap events show exactly when collections fire.
Operator choice matters too: a flatMapLatest building intermediate lists creates the same pressure - see Concurrency.
Sources: ART improvements (AOSP) · Perfetto memory events
Bitmap memory across API versions
Bitmaps are where most apps hit memory limits, and the platform's behavior has changed twice.
API < 26 (pre-Oreo). Pixel buffers live in the Java/Dalvik (managed) heap. Bitmaps count against the Java cap directly, accounting is honest, and the GC reclaims them as regular managed objects. The downside is that a decoded bitmap eats straight into the same cap the rest of the app shares, so a grid of large bitmaps reaches OutOfMemoryError fast. bitmap.recycle() exists to drop the pixel buffer immediately rather than waiting on the next GC.
API 26+ (Oreo). The pixel buffer moved into the native heap; references and metadata stay in Java. Pixels no longer count against the Java cap, though they consume the same physical RAM. Android still tracks the allocation, and a NativeAllocationRegistry frees the native bytes when the wrapper is GC'd, so bitmap.recycle() is rarely necessary.
Bitmap.Config.HARDWARE (also API 26+). Allocate directly in graphics memory, bypassing both heaps. The CPU can't read pixels back (getPixel() fails), but the GPU samples them during composition. Loaders prefer HARDWARE because it sidesteps the Java cap entirely.
val opts = BitmapFactory.Options().apply {
    // API 26+; bitmap lives in graphics memory, off the Java heap entirely.
    inPreferredConfig = Bitmap.Config.HARDWARE
}
val bitmap = BitmapFactory.decodeStream(stream, null, opts)
// bitmap.getPixel(x, y) throws - pixels are GPU-side only.
The catch: HARDWARE bitmaps are upload-once. A transformation that needs CPU access (color filter in code, software canvas draw) silently falls back to an ARGB_8888 copy in the Java heap, doubling the cost.
| Era | Where pixels live | Counts against Java heap | recycle() needed |
|---|---|---|---|
| API < 26 | Java/Dalvik heap | Yes | No - GC handles it, recycle() frees early |
| API 26+ default | Native heap | No | No - NativeAllocationRegistry frees via GC |
| API 26+ HARDWARE | Graphics pool | No | No - released with the reference |
OOM kill signals
Two completely different OOM modes. Conflating them is the most common memory mistake in interviews.
In-process Java OOM
An allocation can't fit; ART has run a full GC trying to make room; it failed; it throws java.lang.OutOfMemoryError. Catchable in principle, unrecoverable in practice - heap state at throw is unsalvageable. Let it crash, ship a crash reporter that captures the dump, design upstream to never approach the cap. Runtime.getRuntime().maxMemory() returns it: typically 192 MB on small devices, 256 - 384 MB on mid-range, 512 MB on premium. android:largeHeap="true" raises it a few hundred MB but only shifts the threshold.
lmkd kill
The Low Memory Killer daemon (lmkd) watches system-wide pressure via the kernel's PSI interface and SIGKILLs whole processes in priority order - foreground last, cached background first. Your process doesn't catch an exception, doesn't get a callback, just disappears. On the next launch, Activity state may restore from the saved-state Bundle, but in-memory caches and drafts are gone.
The onTrimMemory(level) callback on ComponentCallbacks2 is the heads-up before lmkd acts. RUNNING_* levels fire while foreground and the system is tightening; the others fire while backgrounded. The right response is to drop caches down through the levels:
override fun onTrimMemory(level: Int) {
    super.onTrimMemory(level)
    when {
        level >= TRIM_MEMORY_RUNNING_CRITICAL -> imageLoader.memoryCache?.clear()
        level >= TRIM_MEMORY_RUNNING_LOW -> imageLoader.memoryCache?.trimToSize(0)
        level >= TRIM_MEMORY_UI_HIDDEN -> imageLoader.memoryCache?.trimToSize(targetSize / 2)
    }
}
By RUNNING_CRITICAL you have seconds before lmkd picks a victim. A Java OOM hits the UncaughtExceptionHandler chain so a crash reporter sees it; an lmkd kill produces nothing. Detecting "we were killed for memory" requires the next launch reading ActivityManager.getHistoricalProcessExitReasons() (API 30+) for REASON_LOW_MEMORY.
References, leaks, and cleanup
Reference types are the vocabulary for cache design and leak diagnosis:
- Strong is the default; the object is reachable, won't be collected.
WeakReference<T>- cleared on the next GC regardless of pressure. "Refer if alive, don't keep alive." Image loaders use it for currently-displayed bitmaps; LeakCanary watches un-collected Activities through it.SoftReference<T>- cleared only under memory pressure, after weak refs but before OOM. Tempting for caches, but ART clears them aggressively andLruCachewith a fixed byte budget gives better hit rates. Modern Android caches almost never use it.PhantomReference<T>+ReferenceQueue- never resolvable (get()returns null); enqueues a cleanup callback when the object is finalized. The modern API isjava.lang.ref.Cleaner(API 33+), used by NDK wrappers to free native buffers when the Java wrapper goes away:
class NativeBuffer(size: Int) {
    private val handle = nativeAllocate(size)
    private val cleanable = cleaner.register(this) { nativeFree(handle) }
    fun close() = cleanable.clean()
    companion object {
        private val cleaner = Cleaner.create()
        private external fun nativeAllocate(size: Int): Long
        private external fun nativeFree(handle: Long)
    }
}
Leaks on Android are almost always something long-lived holding something that should have died. Three shapes:
- Static reference to an Activity Context - a singleton stores it and pins the view hierarchy. Use
applicationContextfor anything that outlives a screen. - Inner class or lambda capturing
this-Handler.postDelayed { update() }posted from an Activity captures it; if the post fires afteronDestroy, the Activity lives until the message drains. - Listener registered without unregister -
LocationManager,BroadcastReceiver,SensorManager,LiveData: the system holds your listener, your listener holdsthis.
LeakCanary's heuristic: on onDestroy, push a WeakReference into a queue; after a GC plus delay, if it still resolves, dump the heap and walk back to the GC root.
The Java / native boundary is also where async-signal-safety matters. A native crash handler on SIGSEGV must not call malloc - the allocator may hold a lock the dying thread was using, and re-entering deadlocks the process. Crash Reporter covers this in depth.
See also
- Concurrency - dispatcher and operator choices determine allocation pressure; a
flatMapLatestover chatty upstreams is a GC magnet. - How Rendering Works - the frame budget a GC pause eats into; the RenderThread blocks when the main thread is mid-collection.
- Image Loading Internals - the two-pass decode and
Bitmap.Configchoices applied; this page is the heap side, that page is the loader side. - Performance and Profiling - Perfetto's
art:Heapevents, Studio's allocation tracker, Macrobenchmark for memory regressions. - NDK and JNI - async-signal-safety in crash handlers; why
mallocis forbidden inside a SIGSEGV handler.
Used in
- Photo Gallery App - the entire grid-perf design rests on this material; thumbnail tiering,
Bitmap.Config.HARDWAREfor visible cells,onTrimMemoryto clear off-screen tiers, the OOM avoidance math. - Newsfeed App - the
LazyColumnof mixed-media cells must keep the Java heap stable across hours of scroll, with cache eviction tied toonTrimMemory. - Doc Editor App - large documents push toward the heap cap; splitting the renderer into a separate process isolates document-pixel memory so an OOM kills only the renderer.
- Crash Reporter SDK - the native handler chapter hinges on async-signal-safety inside SIGSEGV; the breadcrumb buffer's size budget is bounded by what survives both an lmkd kill and an in-process Java OOM.
- Messenger App - the WebSocket and message-history budgets are tuned against
TRIM_MEMORY_RUNNING_LOWso the foreground process stays alive when the system is tight.
Done reading? Mark it so it sticks in your dashboard.