Mobile Core Concepts
Performance and Profiling
Why a performance claim without a measurement is a guess, and the tools an interviewer expects you to reach for when a frame budget or startup target is on the line.
Performance work on Android lives or dies on measurement. A candidate who says "we'd cache that, it'd be faster" without naming a tool to verify the claim has skipped the only part of the answer that distinguishes a senior from a mid-level engineer. This page walks through the six measurement tools that cover the four contexts a real team operates in - local dev investigation, automated CI gates, in-the-wild production telemetry, and ahead-of-time install-time optimization - and ends with a decision table mapping each common performance signal to the right tool. The model that profiling surfaces (frame pipeline, GC pauses, RenderThread, Binder transactions) is the subject of the rendering and memory entries; this page is about the instruments, not the substrate.
Four measurement contexts
Every performance tool serves one or two of these contexts well. Confusing them - using a dev-machine profiler to investigate a production p99, or trying to reproduce a user's jank on a beefy Pixel 8 Pro - is the most common waste of time on a mobile perf team.
| Context | Question it answers | Right tools |
|---|---|---|
| Dev machine, USB-attached device | Why is this slow here? | Android Studio Profilers, Perfetto |
| CI runner, locked-down device | Did this PR regress startup or scroll? | Macrobenchmark, Microbenchmark |
| Production, every user's device | What's slow for users in the wild? | Firebase Performance, Sentry, Datadog Mobile RUM |
| Install time, every shipped APK | Can we eliminate the first-launch JIT cliff? | Baseline Profiles |
The four columns aren't substitutes. Production RUM tells you something is wrong at p99 startup but not why. A local Perfetto trace tells you why on your phone but not whether it's the same cause users hit. The pair makes the diagnosis; either one alone leaves you guessing.
Macrobenchmark
Macrobenchmark is the Jetpack library for end-to-end measurement of user-visible metrics: cold/warm/hot startup time, frame timing during a scroll, navigation latency between screens, power draw during a workload. It drives the app from outside the process using UI Automator, then collects metrics over the run. The library runs the same scenario multiple iterations and reports min, median, p95 with confidence intervals.
@RunWith(AndroidJUnit4::class)
class StartupBenchmark {
    @get:Rule val rule = MacrobenchmarkRule()

    @Test fun coldStartup() = rule.measureRepeated(
        packageName = "com.example.app",
        metrics = listOf(StartupTimingMetric()),
        iterations = 10,
        startupMode = StartupMode.COLD,
    ) {
        pressHome(); startActivityAndWait()
    }
}
The Gradle setup matters: Macrobenchmark lives in a separate module of type com.android.test that depends on the production app. That separation is what lets it test a release build (the only build that's representative) without the benchmark code being part of the shipped APK.
The two metrics that come up in every interview are StartupTimingMetric (timeToInitialDisplay, timeToFullDisplay) and FrameTimingMetric (frame durations, jank counts via the JankStats definition). TraceSectionMetric("My.Section.Name") lets you measure a specific Trace.beginSection block - useful for "how long does our feed parser take" without bolting on custom instrumentation. PowerMetric requires a rooted or specific device to read battery rails.
The interview move with Macrobenchmark is CI regression gating: a PR that pushes median cold startup from 480 ms to 540 ms fails the benchmark check. That's the discipline that keeps a 50-screen app's startup from accreting 5 ms per PR until it's two seconds slow and nobody can point at the cause.
Sources: Macrobenchmark overview
Microbenchmark
Microbenchmark is the sibling library for hot-loop CPU benchmarks at the function level - "how fast does our MessageParser.parse(json) run on a P95 device." It runs as an instrumented test in the same process as the code under test, and crucially it forces the device into a stable state: locks CPU clocks, disables the interactive governor, runs warmup iterations until timing stabilizes, then measures.
@RunWith(AndroidJUnit4::class)
class ParserBenchmark {
    @get:Rule val rule = BenchmarkRule()
    private val payload = loadFixture("message-batch.json")

    @Test fun parseBatch() = rule.measureRepeated {
        MessageParser.parse(payload)
    }
}
Without clock locking, repeating the same benchmark on the same device returns wildly different numbers - the SoC's thermal governor scales clocks based on temperature, foreground apps, and recent activity. Microbenchmark's stability machinery is what makes the numbers comparable across PRs.
The distinction from JMH (the JVM's canonical microbenchmark library) is that JMH targets HotSpot, not ART, and doesn't know about Android's clock governor. Use Microbenchmark on Android; reach for JMH only for pure JVM library benchmarks run on a server.
Microbenchmark won't tell you whether a user sees the speedup - that's Macrobenchmark's job. They're complementary: Microbenchmark proves a function is faster, Macrobenchmark proves the user notices.
Perfetto
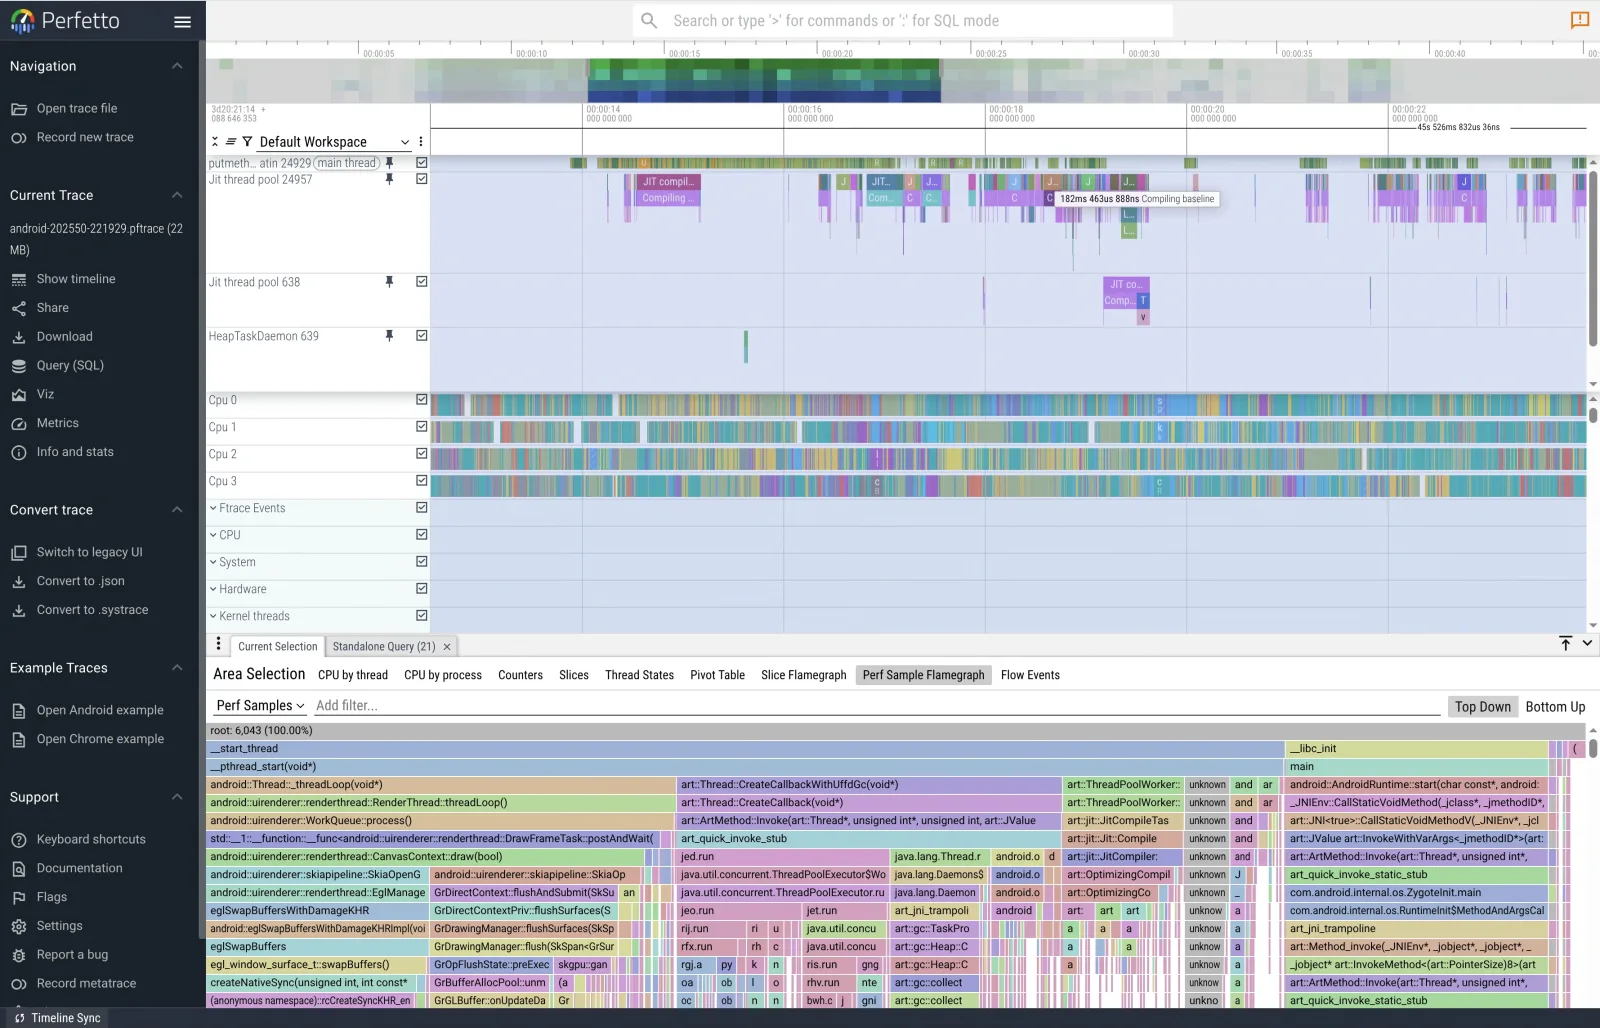
Perfetto is the modern system-tracing platform. It captures a unified timeline of CPU scheduling, GPU work, Binder transactions, GC events, frame timings, custom app trace sections, ftrace kernel events, and Android system services into a single .perfetto-trace file. Open it in ui.perfetto.dev and you get an interactive flame-graph timeline across every thread and process on the device.
fun renderFeed(items: List<FeedItem>) {
    Trace.beginSection("Feed.render")
    try {
        val visible = layoutManager.computeVisibleRange()
        Trace.beginSection("Feed.bind").also { adapter.bind(visible) }
        Trace.endSection()
    } finally { Trace.endSection() }
}
Those beginSection / endSection calls show up as named bars on the app's main-thread track in the Perfetto UI. Pair them with the kernel's own ftrace bars and you can see, frame by frame, what the main thread was doing when it missed VSYNC: parsing JSON, blocked on a Binder transaction into PackageManager, blocked behind a GC pause, or actually drawing.
The interview move: "I'd capture a 5-second Perfetto trace during the slow scroll, then look for the frames where MainThread was off-CPU and check what woke it up - usually a Binder reply, a Choreographer callback, or a Handler message from another thread." That's a sharper answer than "I'd profile it" because it names a specific signal (off-CPU time on main) and what the trace will reveal.
systrace is the older command-line wrapper around the same data pipeline; both surface the same underlying ftrace/atrace events. Perfetto is the current name, the current UI, and the format Android Studio's CPU profiler reads when you record a "System Trace."
Sources: Perfetto docs · Capture a system trace
Android Studio Profilers
The IDE ships four interactive profilers attached to a running debug build:
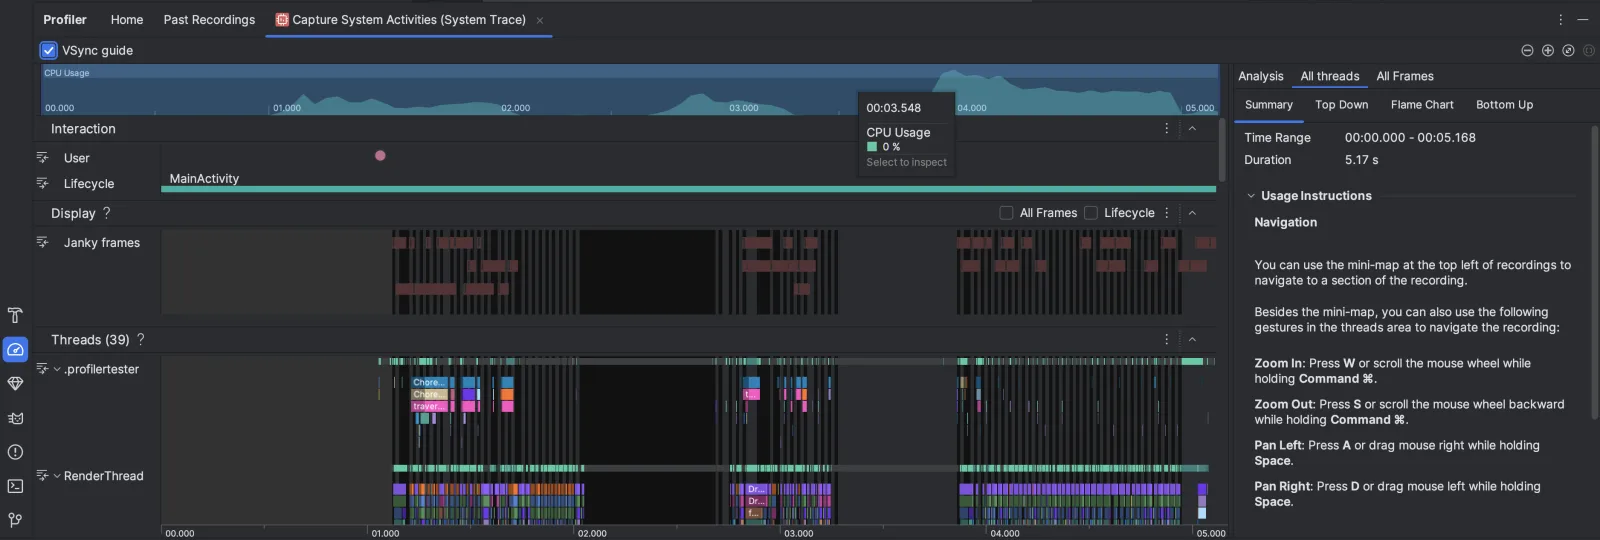
- CPU Profiler. Records method traces (Java/Kotlin call stacks sampled at high frequency), or system traces (Perfetto under the hood, with the IDE's UI on top). Use system trace for frame-pipeline work, method trace for "which function is hot."
- Memory Profiler. Heap dumps (HPROF), allocation tracking, and native-heap profiling on API 26+. The "Record allocations" mode shows every
newover a window - useful for finding the per-frame allocation that's triggering GC pauses. - Energy Profiler. Estimates power draw by component (CPU, network, GPS). The estimates are model-based, not battery-rail reads - use them for relative comparison ("is this background task waking the radio every minute") but never for absolute "we draw N mAh" claims. Battery Historian on a rooted device gets you closer to truth.
- Network Profiler. Logs every HTTP request through OkHttp and
HttpURLConnectionout of the box. Doesn't see Cronet or raw socket traffic; for those, Charles / mitmproxy on a system proxy is the fallback.
Profilers attach to debug builds because release builds strip the instrumentation hooks. That immediately limits their use: a Profiler trace is representative of the debug code path, including extra logging, assertion overhead, and the JIT-compiled (not AOT) code path. For numbers that match what users experience, you need a release build and Macrobenchmark or Perfetto on a side-loaded APK.
The Profilers are best for ad-hoc local investigation: someone reports a jank, you reproduce it locally, you attach the profiler, you find the cause. They're a poor fit for CI gates (no headless integration), for production telemetry (debug-only), or for cross-PR regression detection (no automated comparison).
LeakCanary
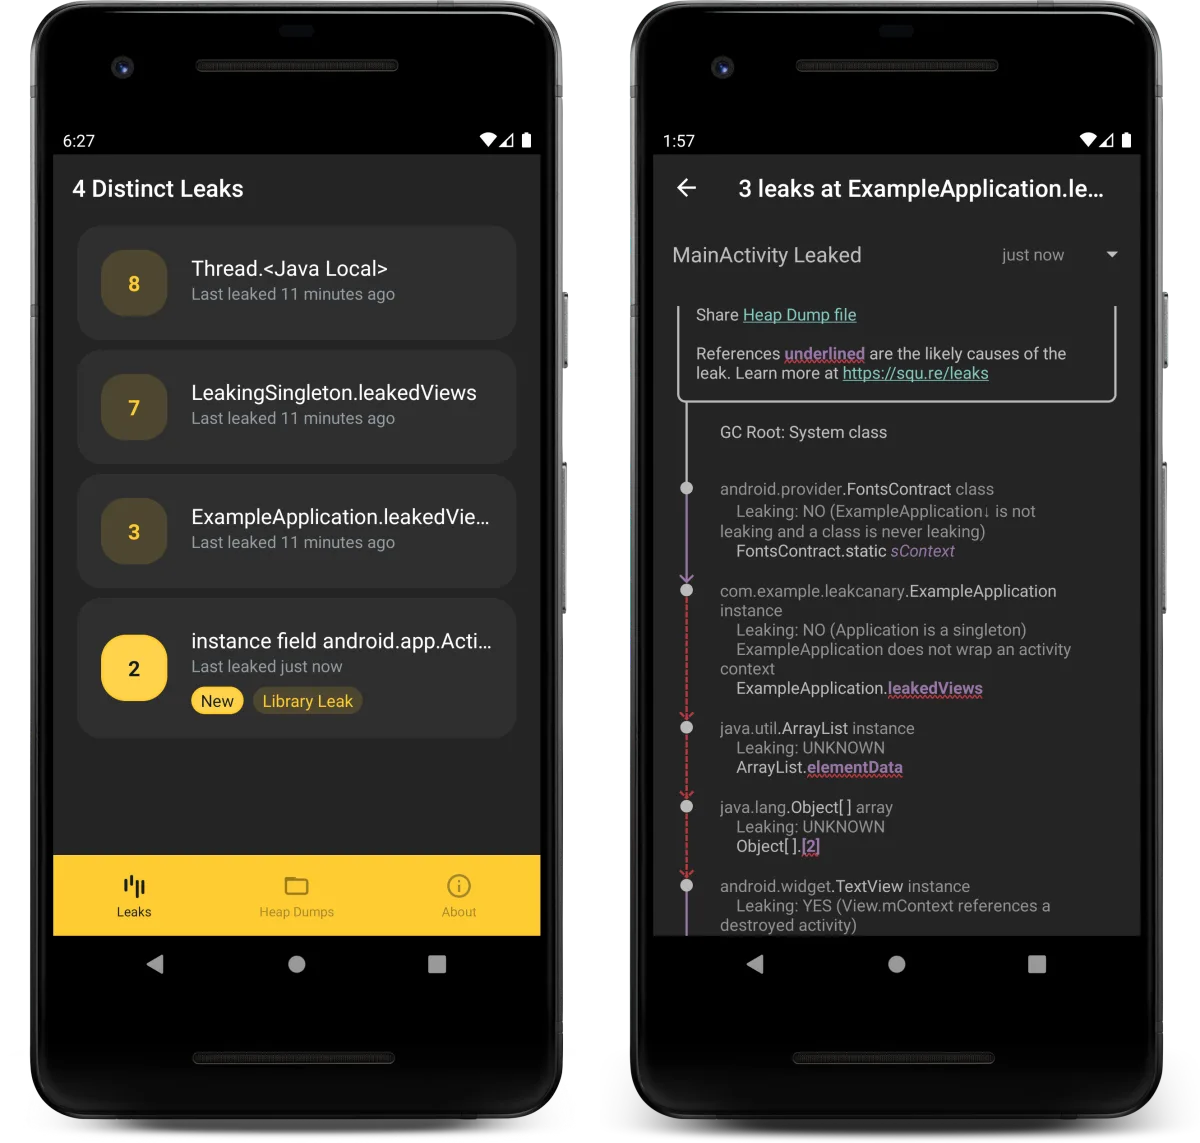
LeakCanary is the drop-in heap analyzer for Activity, Fragment, ViewModel, and View retention leaks. It's a single Gradle dependency in debugImplementation; you don't initialize it - the library installs itself via a ContentProvider-bootstrap trick when your debug build starts.
debugImplementation("com.squareup.leakcanary:leakcanary-android:2.14")The detection model is straightforward. LeakCanary registers a callback on Activity.onDestroy (and equivalent for Fragments / ViewModels / Views). When onDestroy fires, the just-destroyed object is added to a WeakReference watch set. A few seconds later, LeakCanary forces a GC and checks the watch set. If the WeakReference is still resolvable, the object survived a GC after its expected death - that's the leak signal. LeakCanary then dumps the heap, walks the shortest path from a GC root to the leaked object, and surfaces a notification with the retained-reference chain.
The canonical patterns it catches in interview answers:
- Static field holding a
Context. Acompanion objectfield or top-levelvarreferencing anActivitykeeps it alive pastonDestroy. UseapplicationContext(process-scoped, fine to hold) or pass the dependency through a scope-bound holder. - Anonymous-inner-class listener registered on a long-lived object. Registering
LocationManager.requestLocationUpdates(this, listener)and never unregistering retains the enclosingActivitythrough the listener's implicit outer reference. Handlerwith a queuedMessagereferencing a destroyed Activity. Messages queued viahandler.postDelayed { activity.refresh() }hold the lambda (and the Activity) until the message is dispatched or removed. Cancel ononDestroy.
The non-negotiable rule: debug-only. LeakCanary's heap dumps are expensive and pause the app. Shipping it in release builds is a guaranteed performance regression for users. The dependency is debugImplementation, not implementation, and that's essential.
Sources: LeakCanary docs
Baseline Profiles
A Baseline Profile is a baseline-prof.txt file bundled into the APK/AAB listing class+method signatures that should be AOT-compiled at install time rather than left for ART's JIT to compile after the user has hit them. The effect: methods listed in the profile are compiled to native code before the user ever launches the app, eliminating the first-launch JIT cliff and the per-launch interpreter-to-JIT transition.
Numbers from Google's published case studies: a typical mid-tier device sees 20-40% reduction in cold-startup time on profile-covered code paths. Jetpack Compose ships its own baseline profile in the Compose libraries; your app should also contribute its own, covering the first-screen-after-startup code path and any latency-sensitive flows.
Generation is a Macrobenchmark scenario using BaselineProfileRule:
@RunWith(AndroidJUnit4::class)
class BaselineProfileGenerator {
    @get:Rule val rule = BaselineProfileRule()

    @Test fun generate() = rule.collect("com.example.app") {
        pressHome(); startActivityAndWait()
        device.findObject(By.text("Feed")).click()
        device.wait(Until.hasObject(By.res("feed")), 5_000)
    }
}
The rule runs the journey, records every method ART touches, and emits a baseline-prof.txt. You commit that file; the AGP build packs it into the APK; the installd daemon AOT-compiles the listed methods when the user installs the app. Generate against a release-equivalent build (R8 enabled, signed) - a profile recorded from a debug build lists methods that won't match the R8-optimized release bytecode, and most of it becomes useless.
Cold startup on a low-end device has three rough phases: process fork from Zygote, Application.onCreate, then Activity.onCreate to first frame drawn. Baseline Profiles target the second and third phases - anything before Activity.onCreate is system-side and outside your control. The journey you record should cover both, plus the immediate post-startup screen the user lands on.
Production RUM (Firebase Performance, Sentry Mobile, Datadog Mobile RUM) is the one tool category this page doesn't deep-dive but that closes the loop. Developer-side profiling shows you what's wrong on a specific device under your hands. Production telemetry shows you what's wrong for the users in the wild who don't file bug reports. A mature mobile perf team has both, and a baseline-profile change is usually the result of a production p99-startup signal that points at a specific not-yet-AOT-compiled hot path.
When to reach for which
The single most useful artifact for an interviewing candidate. Signal in the left column, tool in the right.
| If the signal is | Reach for |
|---|---|
| "Scroll jank on this specific screen, on my phone" | Perfetto (capture trace, look for off-CPU main thread) |
| "Cold startup feels slow on a low-end device" | Macrobenchmark StartupTimingMetric + Baseline Profile |
| "Memory bloat after navigating between screens" | Android Studio Memory Profiler (heap dump comparison) |
| "Leak after device rotation" | LeakCanary (in debug build) |
| "Did this PR regress startup time?" | Macrobenchmark in CI, fail the check on p95 delta |
| "Did this PR regress our JSON parser?" | Microbenchmark in CI |
| "First-launch is slow only for new installs" | Baseline Profile (the JIT cliff signal) |
| "Production p99 startup is bad but we can't reproduce" | Firebase Performance / Sentry Mobile / Datadog Mobile RUM |
| "Frame drops only when WebView is on screen" | Perfetto + Chromium tracing (two pipelines, both needed) |
| "Battery drain reports from users" | Energy Profiler for local, RUM for fleet-wide |
The pattern: name the signal, name the tool, name what the tool will show. "I'd profile it" loses to "I'd attach Macrobenchmark in CI on cold startup and gate the merge on p95 regression."
See also
- How Rendering Works - the frame pipeline that Perfetto and
FrameTimingMetricsurface. Knowing the pipeline tells you what to look for in the trace. - Memory and GC - GC pauses are a frame-budget killer that shows up in Perfetto as
Concurrent copying GCbars and in the Memory Profiler as allocation spikes; this page covers the tools, that one covers the model. - Concurrency - main-thread blocking is the most common Perfetto finding;
withContext(Dispatchers.IO)is the most common fix. - IPC - long Binder transactions show up in Perfetto as
[waiting on Binder]on the main thread; this is how you find the "expensive system-service query in a loop" anti-pattern.
Used in
- Crash Reporter SDK - the production RUM story for crashes is the sibling discipline to performance RUM; the SDK's own startup cost is itself a Macrobenchmark target (your monitoring shouldn't be the regression).
- Newsfeed App - feed-fling jank is a Perfetto +
FrameTimingMetricproblem; the Baseline Profile covers the cold-start-to-first-card journey. - Photo Gallery App - the
LazyVerticalGridscroll test is the canonical MacrobenchmarkFrameTimingMetricscenario; the bitmap-cache memory budget is a Memory Profiler heap-dump exercise. - Messenger App - WebSocket reconnect latency and message-send round-trip are RUM-side metrics; cold-start to first-message-visible is a Baseline Profile target.
- Doc Editor App - if the design picks WebView for the editor surface, frame timing requires both Perfetto (native side) and Chromium tracing (web side) to fully diagnose.
Done reading? Mark it so it sticks in your dashboard.